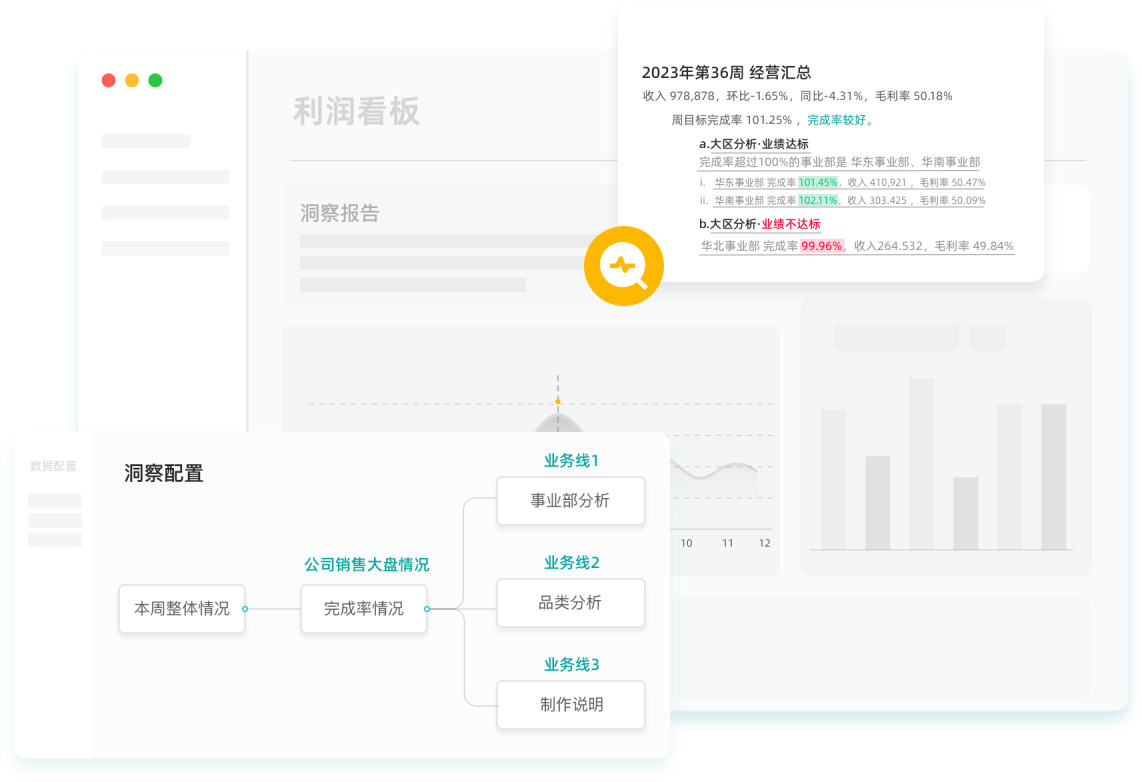
我观察到一个现象,很多企业在数字化转型上投入巨大,但衡量BI系统价值时,往往只盯着软件采购和人力成本,却忽略了最大的隐形成本——由数据不通畅导致的低效决策。说白了,你买的BI工具可能只是一个昂贵的数据“花瓶”,看似光鲜,却没能真正帮你赚钱或省钱。真正的价值释放,关键在于实现BI指标联动。当不同业务环节的数据能够相互“对话”,比如将广告投放的成本(Cost Per Click)与最终的客户生命周期价值(LTV)直接关联分析,决策的质量和效率才会发生质的飞跃。这笔账,关乎企业每一分钱的投入产出比,必须算清楚。

一、如何量化数据孤岛导致的成本黑洞?
一个常见的痛点是,各部门都觉得自己掌握了“真理”,但这些“真理”却互相矛盾。营销部说活动带来了大量新用户,销售部却说线索转化率低得可怜。这种场景的背后,就是数据孤ah岛吞噬决策效率的典型表现。行业研究表明,知识型员工大约有20%的时间浪费在寻找和整合 fragmented 数据上。这不仅仅是时间成本,更是巨大的机会成本和决策风险成本。换个角度看,这20%的效率损失,完全可以换算成实实在在的财务数字。如果一个数据分析团队年薪总支出是500万,那么每年就有100万的人力成本被“内耗”掉了。而这还没算上因为数据延迟和错误导致的战略误判,其损失更是难以估量。实现BI指标联动,正是解决这一问题的核心。比如,通过BI指标联动,我们可以将营销自动化工具里的用户行为数据、CRM里的销售跟进记录以及ERP里的订单回款数据串联起来。这样一来,CEO在dashboard上看到的就不是孤立的“官网访问量”,而是一条完整的价值链:从广告曝光、用户点击、注册转化、首次购买,到最终复购和利润贡献。这种全局视角,让成本和收益一目了然,每一笔投入都能追溯到最终的产出。可以说,BI指标联动将数据从成本中心转变成了利润中心。特别是在电商领域,电商平台指标联动应用尤为重要,它直接关系到库存、物流和营销的协同效率,是提升利润率的关键。
| 成本计算器:数据孤岛的隐性成本评估 |
|---|
| 成本项 | 计算方式 | 预估年度损失 (以50人数据团队为例) |
| 人力内耗成本 | 团队年薪总额 * 20%时间浪费 | ¥1,000,000 - ¥1,500,000 |
| 决策失误成本 | 错误决策导致的直接财务损失 (如广告错投、库存积压) | ¥500,000 - ¥5,000,000+ |
| 机会错失成本 | 因数据延迟未能抓住的市场机会 (如爆款趋势) | 难以估量,但往往是最高的 |
| 总计 | 通过BI指标联动可优化的潜在成本 | 最低 ¥1,500,000 / 年 |
二、处理非结构化数据,ROI真的划算吗?

说到数据,很多管理者会头疼非结构化数据,比如用户评论、社交媒体帖子、客服聊天记录等。这些数据包含了丰富的情感和意图信息,但处理起来成本高昂,涉及复杂的数据采集和数据处理技术。一个常见的问题是:投入巨大资源去做情感分析、文本挖掘,ROI(投资回报率)真的划算吗?答案是:如果不做BI指标联动,很可能不划算。我见过不少企业,花钱买了舆情监控系统,每天生成一堆词云和情感分数报告,然后呢?这些报告孤零零地躺在那里,无法指导具体业务决策,最终沦为“数据表演”。更深一层看,非结构化数据的价值,必须通过与结构化业务指标的联动才能体现。比如,我们不仅要分析用户评论的情感是正面还是负面,更要通过BI指标联动,去关联这些评论来自哪个渠道、购买了什么产品、客单价多少、后续有没有复购。这样一来,我们就能清晰地回答一些高价值的业务问题:某个差评集中的产品特性,是否真的导致了退货率的上升?某个KOL在社交媒体上的推荐,是否带来了高LTV(客户生命周期价值)的用户?这种分析能力,才是BI指标联动带来的核心价值,它让每一分投入在非结构化数据处理上的成本,都能清晰地映射到最终的商业回报上。
- 案例分享:深圳某DTC美妆初创品牌的逆袭
- 企业类型:初创公司
- 地域分布:深圳
- 痛点:新品上线后,社交媒体上口碑两极分化,但无法判断是“声量大”的少数人吐槽,还是普遍性问题,更无法衡量其对销售的实际影响。
- 解决方案:该公司利用BI工具,实现了彻底的BI指标联动。他们将爬虫采集的社交媒体评论数据,与电商后台的订单数据、CRM中的用户画像数据进行了打通。通过自然语言处理提取出评论中的核心关注点(如“包装廉价”、“香味刺鼻”),再将这些标签与用户的退货率、复购率进行关联分析。
- 成本效益分析:他们发现,“包装廉价”的吐槽声量虽大,但对应用户的复购率仅下降了5%;而“香味刺鼻”的负面评论虽然不多,但对应用户的退货率却高达40%。基于这一洞察,公司果断调整了产品配方而非包装,仅此一项决策,就在一个季度内减少了约200万元的退货损失和库存成本。这就是BI指标联动将数据成本转化为决策红利的直接体现。
三、实时数据的投入产出比应该如何评估?
“实时”是如今技术圈最热门的词之一,实时计算、实时数仓、实时BI……企业为此投入不菲,但很多人陷入了一个悖论:花了 огромные деньги on building a real-time data pipeline, but the business decisions are still being made on a weekly or even monthly basis. The cost-benefit ratio here is clearly unbalanced. The core issue is that real-time data itself is not the goal; real-time *linked* insights are. Knowing your inventory dropped by 100 units in real-time is mildly interesting. But achieving BI indicator linkage to know that this drop was triggered by a specific influencer's post, whose audience has a 30% higher lifetime value than your average customer, and that your ad spend on that channel just spiked—that is a game-changer. This is where the BI indicator linkage versus data warehouse debate becomes relevant from a cost perspective. A full-scale real-time data warehouse is a massive undertaking, both in terms of cost and technical complexity. For many businesses, especially those in the growth stage, a more pragmatic and cost-effective approach is to use a modern BI platform that supports lightweight, near-real-time data integration and indicator linkage. This allows you to connect key operational metrics without rebuilding your entire data stack, delivering 80% of the value with only 20% of the cost. The key is to evaluate the investment not on the speed of data transfer, but on the speed and quality of the decisions that the linked data enables. An effective BI indicator linkage strategy focuses on high-impact scenarios first, like linking marketing spend to sales conversion in e-commerce, or linking server load to user activity for a SaaS product.
| 评估维度 | 传统批处理BI | 实时BI指标联动 |
|---|
| 初始投入成本 | 中 (主要为ETL开发) | 高 (实时计算框架、消息队列等) |
| 决策延迟成本 | 高 (T+1决策,错失机会) | 极低 |
| 运营效率提升 | 约 15% (行业基准) | 35% - 50% (通过实时联动优化) |
| 典型场景ROI | 6-12个月回本 | 3-6个月回本 (因决策效率极高) |
| 实现复杂度 | 中 | 高,但可通过敏捷BI工具降低 |
四、指标口径不一致会带来多大的经济损失?
指标口径冲突,可以说是企业数据治理中最普遍、也最烧钱的“内战”。市场部定义的“活跃用户”(月登录一次)和产品部定义的“活跃用户”(完成一次核心操作)天差地别,财务部统计的“销售额”(确认收款)和销售部统计的“销售额”(合同签订)总对不上。这种冲突的直接后果就是无穷无尽的拉扯和会议,时间都浪费在“对数”上,而不是“做事”。这个成本有多大?它像一只蝴蝶,煽动一下翅膀,就能在预算和战略层面掀起一场风暴。例如,基于市场部虚高的“活跃用户”数,公司可能超额投入了服务器和带宽成本;基于销售部乐观的“销售额”,公司可能制定了不切实际的扩张计划,导致资金链紧张。这一切的根源,在于缺乏一个统一的、被业务和技术共同认可的指标体系。而BI指标联动,恰恰是 enforcing this unified system 的最佳工具。一个 properly designed indicator system, implemented through a central BI platform, acts as the single source of truth. When the definition of 'New Customer Revenue' is standardized and linked across the marketing, sales, and finance dashboards, the arguments cease. It's not about IT dictating rules; it's about the business reaching a consensus and then codifying it into the BI system. The cost saving here is immense: reduced communication friction, eliminated redundant reporting work, and most importantly, minimized risk of catastrophic strategic misjudgments. Therefore, investing in indicator system design is not an IT expense; it's a strategic investment in decision-making accuracy with a clear and high ROI. The successful implementation of BI indicator linkage is built upon this foundation.
- 误区警示:指标统一只是IT部门的工作
- 误区描述:很多业务部门认为,统一指标口径是数据部门或者IT部门的“分内之事”,业务部门只负责提需求和使用数据。
- 事实真相:指标的定义权本质上是业务话语权。比如“有效线索”的定义,直接决定了市场部的工作成果如何被衡量,也影响销售部的跟进策略。如果IT部门闭门造车定义指标,必然无法贴合业务实际,最终会被弃用。正确的做法是,由业务负责人、数据分析师、IT工程师共同组成虚拟团队, business-driven, IT-enabled, collaboratively de and manage the indicator system. The core of BI indicator linkage lies in this collaborative process.
五、如何从“低质量数据”中榨取剩余成本价值?
传统观念里,低质量数据——比如重复、缺失、矛盾的数据——是需要被清洗或丢弃的“垃圾”,处理它们是 pure cost. But let's switch our perspective. What if we could extract value from this 'bad' data? This is a form of reverse thinking in cost-benefit analysis. Instead of launching a massive, expensive data-cleansing project upfront, we can use a BI indicator linkage strategy to highlight inconsistencies and turn them into valuable operational signals. For example, if your CRM system shows a customer's order as 'paid', but the finance system shows 'payment pending', this discrepancy isn't just 'bad data'. It's a signal of a potential process flaw, a system integration bug, or even a payment fraud risk. An intelligent BI platform, through indicator linkage, can be configured to automatically flag these mismatches. This approach has a much lower upfront cost than a full data warehouse ETL/cleansing project. It doesn't aim for perfect data, but for valuable insights from imperfect data. It helps you identify the most critical areas for process improvement, allowing you to prioritize your data governance efforts where the financial impact is greatest. In essence, you are using the BI system not just for reporting, but as an active diagnostic tool. This method of 'validating through discrepancy' is a highly cost-effective first step for companies starting their data governance journey. It turns a data quality problem, which is a cost center, into a business process optimization opportunity, which is a value driver. The BI indicator linkage is the mechanism that makes this transformation possible.
- 技术原理卡:基于BI指标联动的差异校验
- 原理简介:该方法不依赖于重量级的数据仓库进行暴力清洗,而是利用BI工具的数据模型和计算引擎,在应用层面对来自不同源头的关键指标进行交叉验证。
- 实现步骤:1. 数据连接:在BI工具中同时连接到多个数据源,如CRM数据库和财务软件API。2. 指标建模:创建两个独立的指标,例如`CRM_Order_Status`和`Finance_Payment_Status`,并使用共同的`OrderID`作为关联键。3. 计算差异:创建一个新的计算字段或度量值,`Status_Mismatch = IF(CRM_Order_Status != Finance_Payment_Status, 1, 0)`。4. 可视化告警:在仪表盘上创建一个表格或KPI卡片,专门显示`SUM(Status_Mismatch)`。当数值大于0时,通过颜色(如红色)或邮件告警,提示运营人员介入调查。
- 成本效益:相比构建ETL pipeline来 unification data, which can take months and significant engineering resources, this approach can often be implemented in a BI tool within days. It provides immediate diagnostic value and helps pinpoint where to invest in deeper data integration, making it a highly cost-effective strategy for continuous improvement. The core idea is to leverage the analytical power of BI indicator linkage for governance.
本文编辑:帆帆,来自Jiasou TideFlow AI SEO 创作
版权声明:本文内容由网络用户投稿,版权归原作者所有,本站不拥有其著作权,亦不承担相应法律责任。如果您发现本站中有涉嫌抄袭或描述失实的内容,请联系我们jiasou666@gmail.com 处理,核实后本网站将在24小时内删除侵权内容。
