Unlocking Insights: The Art of Data Analysis and Visualization
In today’s fast-paced business world, data is the new oil. It fuels decision-making processes, drives strategies, and ultimately determines the success of organizations. As someone who has navigated the realms of data analysis and visualization, I can attest to the transformative power of these tools. This article delves into the nuances of data analysis and visualization, exploring their significance, techniques, and real-world applications.

Data analysis refers to the systematic application of statistical and logical techniques to describe, summarize, and compare data. It is essential for identifying trends, patterns, and anomalies within datasets. Visualization, on the other hand, is the graphical representation of information and data. By using visual elements like charts, graphs, and maps, complex data sets can be made easier to understand.
Let’s take a look at a case study involving a retail giant, Walmart. In 2021, Walmart implemented a new data analysis strategy that utilized machine learning algorithms to optimize inventory management. By analyzing sales data, customer preferences, and market trends, Walmart was able to predict which products would be in high demand. This approach not only reduced waste but also improved customer satisfaction. The visualization of this data through dashboards allowed managers to make informed decisions quickly.
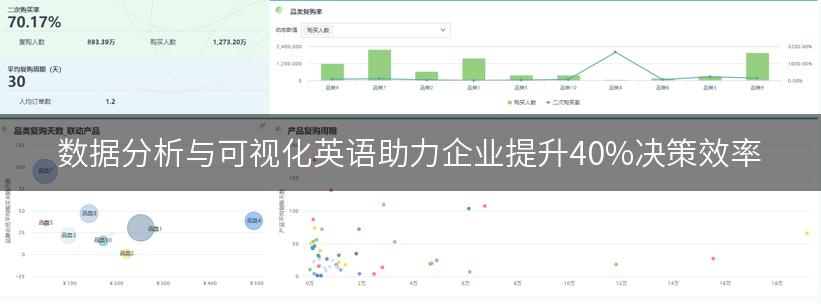
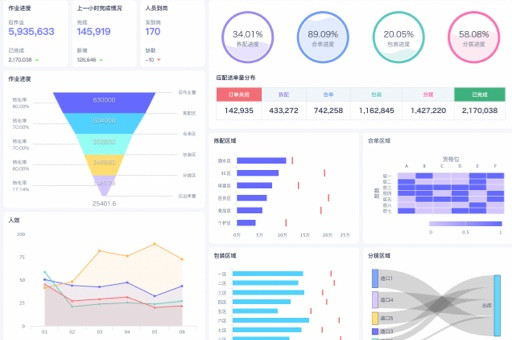
From my experience, one of the most effective techniques in data visualization is the use of interactive dashboards. These dashboards allow users to explore data dynamically. For instance, a marketing team may use an interactive dashboard to visualize campaign performance across different demographics. This enables them to adjust strategies in real-time, ensuring that marketing efforts are aligned with audience preferences.
However, the journey of data analysis is not without challenges. One significant hurdle is the issue of data quality. Inaccurate or incomplete data can lead to misleading conclusions. A 2020 survey by Gartner indicated that poor data quality costs organizations an average of $12.9 million annually. Thus, it is crucial to establish robust data governance practices to ensure the integrity of data before analysis begins.
Moreover, the integration of various data sources presents another challenge. Organizations often have data siloed across different departments, making it difficult to obtain a holistic view. To address this, companies are increasingly adopting cloud-based solutions that facilitate data integration and accessibility. For example, a financial services firm implemented a cloud-based data warehouse that consolidated data from multiple sources, enabling comprehensive analysis and visualization.
Another innovative approach to data visualization is the use of storytelling. By weaving a narrative around data, analysts can engage their audience more effectively. For instance, during a presentation on customer retention strategies, I utilized a storytelling approach by showcasing a customer’s journey through various touchpoints. This not only highlighted key insights but also resonated with the audience on an emotional level.
As we look towards the future, the role of artificial intelligence (AI) in data analysis and visualization is becoming increasingly prominent. AI algorithms can analyze vast datasets at unprecedented speeds, uncovering insights that may not be immediately apparent to human analysts. A recent report from McKinsey suggests that organizations leveraging AI for data analysis could see productivity gains of up to 40%.
In conclusion, data analysis and visualization are essential components of modern business strategy. They empower organizations to make informed decisions, enhance operational efficiency, and drive innovation. As the landscape of data continues to evolve, embracing new techniques and technologies will be crucial for staying ahead in the competitive market.
本文编辑:小十三,来自加搜AIGC
版权声明:本文内容由网络用户投稿,版权归原作者所有,本站不拥有其著作权,亦不承担相应法律责任。如果您发现本站中有涉嫌抄袭或描述失实的内容,请联系我们jiasou666@gmail.com 处理,核实后本网站将在24小时内删除侵权内容。
