2023年数据分析及可视化英语助力企业决策的五大趋势
Unlocking the Power of Data Analysis and Visualization in Modern Business
In today's fast-paced business environment, data analysis and visualization have become essential tools for organizations aiming to make informed decisions. The ability to interpret data effectively can mean the difference between success and failure. This article explores the significance of data analysis and visualization from a technological perspective, emphasizing its impact on strategic decision-making.
Data analysis refers to the systematic examination of data sets to draw conclusions about the information they contain. By employing various statistical techniques and tools, businesses can uncover trends, correlations, and patterns that may not be immediately apparent. For instance, a retail company analyzing customer purchase data can identify seasonal buying trends, enabling them to optimize inventory levels and marketing strategies.
One compelling case study is that of Target, the American retail giant. In 2012, Target utilized data analysis to predict customer behavior based on purchasing patterns. They discovered that certain buying behaviors could indicate significant life events, such as pregnancy. This insight allowed Target to send personalized marketing materials to expecting parents, resulting in a substantial increase in sales. This example illustrates how data analysis can lead to targeted marketing strategies that resonate with consumers.
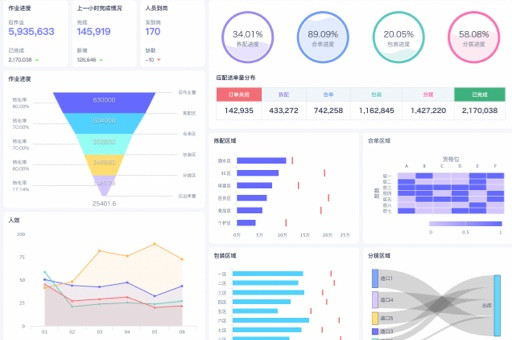
However, raw data alone is not enough; it needs to be presented in a manner that is easy to understand. This is where data visualization comes into play. Data visualization is the graphical representation of information and data, allowing complex data sets to be presented in a clear and accessible format. Tools like Tableau and Power BI have revolutionized how businesses visualize their data. For instance, a financial analyst can create dynamic dashboards that display real-time financial metrics, making it easier for stakeholders to grasp the company's financial health at a glance.
The importance of data visualization is further highlighted by a report from the Data Visualization Society, which found that 65% of people are visual learners. This means that incorporating visual elements into data presentations can significantly enhance understanding and retention. For example, using pie charts to represent market share can quickly convey the competitive landscape to stakeholders, facilitating informed decision-making.
From a personal perspective, I recall a project where my team had to analyze customer feedback for a software product. We gathered thousands of comments and ratings but struggled to identify actionable insights. By employing data visualization techniques, we created infographics that highlighted key themes and sentiments. This not only made our findings more digestible but also helped us present our recommendations to the leadership team effectively.
Moreover, the integration of artificial intelligence (AI) into data analysis and visualization is paving the way for innovative solutions. AI algorithms can analyze vast amounts of data at unprecedented speeds, uncovering insights that would take human analysts weeks to find. A notable example is IBM's Watson, which can analyze unstructured data from various sources, including social media and customer reviews, to provide businesses with actionable insights.
Nonetheless, the rise of data analysis and visualization is not without its challenges. Data privacy concerns are paramount, especially with stringent regulations like the General Data Protection Regulation (GDPR) in Europe. Companies must navigate the line between leveraging data for insights and respecting consumer privacy. This necessitates a robust data governance framework that ensures compliance while still deriving value from data.
In conclusion, data analysis and visualization are indispensable in the contemporary business landscape. They empower organizations to make data-driven decisions that enhance operational efficiency and customer satisfaction. As technology continues to evolve, the potential for data analysis and visualization will only expand, offering exciting opportunities for businesses willing to embrace these tools. The future of data is bright, and those who harness its power will undoubtedly lead the way in their respective industries.
本文编辑:小十三,来自加搜AIGC
版权声明:本文内容由网络用户投稿,版权归原作者所有,本站不拥有其著作权,亦不承担相应法律责任。如果您发现本站中有涉嫌抄袭或描述失实的内容,请联系我们jiasou666@gmail.com 处理,核实后本网站将在24小时内删除侵权内容。
相关文章